Short answer: Customer profitability is what a customer earns you after the full cost to serve them, not their revenue or gross margin. The 15 KPIs below measure it in three groups: revenue quality, cost to serve and strategic value. Measure them by customer-product combination, because in Todd Hagopian's Stagnation Assassin the Refrigeration division had positive gross margins on nearly everything and still lost $175 million a year.
Related reading: Product Line Rationalization for Canadian Businesses: How to Cut SKUs and Triple Profits
Related reading: The Strategic Customer Delusion: Why Your ‘Future Shopify’ Is Killing Your Canadian Business Today
Related reading: How to Fire Unprofitable Customers in Canada: A Professional Guide to Customer Portfolio Optimization
Most companies track revenue by customer and assume the biggest accounts are the best ones. Hidden costs say otherwise: engineering time, setups, expediting, inspections and inventory that standard accounting spreads evenly across everything. Serving the wrong accounts the same way as the right ones is the definition of more work, less profit.
Why Does Gross Margin Hide Unprofitable Customers?
Because traditional cost accounting allocates overhead by volume, not by what each order actually consumes. The book's example, with numbers disguised to protect the company: a $1,000 order with $700 of direct cost shows a 30 percent gross margin. Add setup ($25), engineering support ($25), quality inspections ($20), inventory carrying ($25), management time ($20) and logistics complexity ($5), and true profit is $180, or 18 percent, against a 22 percent overhead rate. The "profitable" order destroyed value.
Activity-based costing made the gap visible by quadrant: the best customer-product combinations went from 47 percent gross margin to 43 percent true margin, while the worst went from 18 percent to minus 3 percent. Engineering consumption varied twentyfold between them.
"Their accounting systems lie to them, not maliciously, but systematically."
Todd Hagopian, Stagnation Assassin, Chapter 4
Revenue Quality: KPIs 1 to 5
- Revenue concentration. Each customer's share of total revenue and profit. Large shares of revenue with small shares of profit are a risk, not an asset.
- Price realization. Net price after discounts, rebates and concessions compared with list.
- Payment terms cost. The financing cost of extended terms, in dollars.
- Order volatility. How erratic the account's orders are, and what that does to scheduling and inventory.
- Product mix profitability. Which of your products this customer buys. A great customer buying your worst products is a problem.
Cost to Serve: KPIs 6 to 10
- Service intensity. Sales, support and engineering hours per dollar of revenue. In the book, the best combinations cost 2.1 percent of revenue to service against 8.3 percent company-wide.
- Order complexity cost. Custom configurations, small orders and setups the account drives.
- Quality cost. Inspections, returns and warranty claims traced to the account.
- Expediting cost. Rush orders, overtime and schedule disruptions the account causes.
- Freight cost. Real logistics cost per order, including special handling.
Strategic Value: KPIs 11 to 15
Use these to test, not excuse, an unprofitable relationship.
- Market access value. Does the account open doors you could not open otherwise? Put a dollar figure on it.
- Innovation partnership. Does the customer co-develop products that sell to others?
- Competitive shield. Would losing the account hand a competitor scale or a foothold?
- Learning value. Does serving them make you measurably better or faster?
- Future option value. A realistic, dated estimate of growth, not "they might grow."
The common mistake: using strategic value to justify every loss. In the book, every value-destroying combination had a story, such as "small accounts that might grow." None grew.
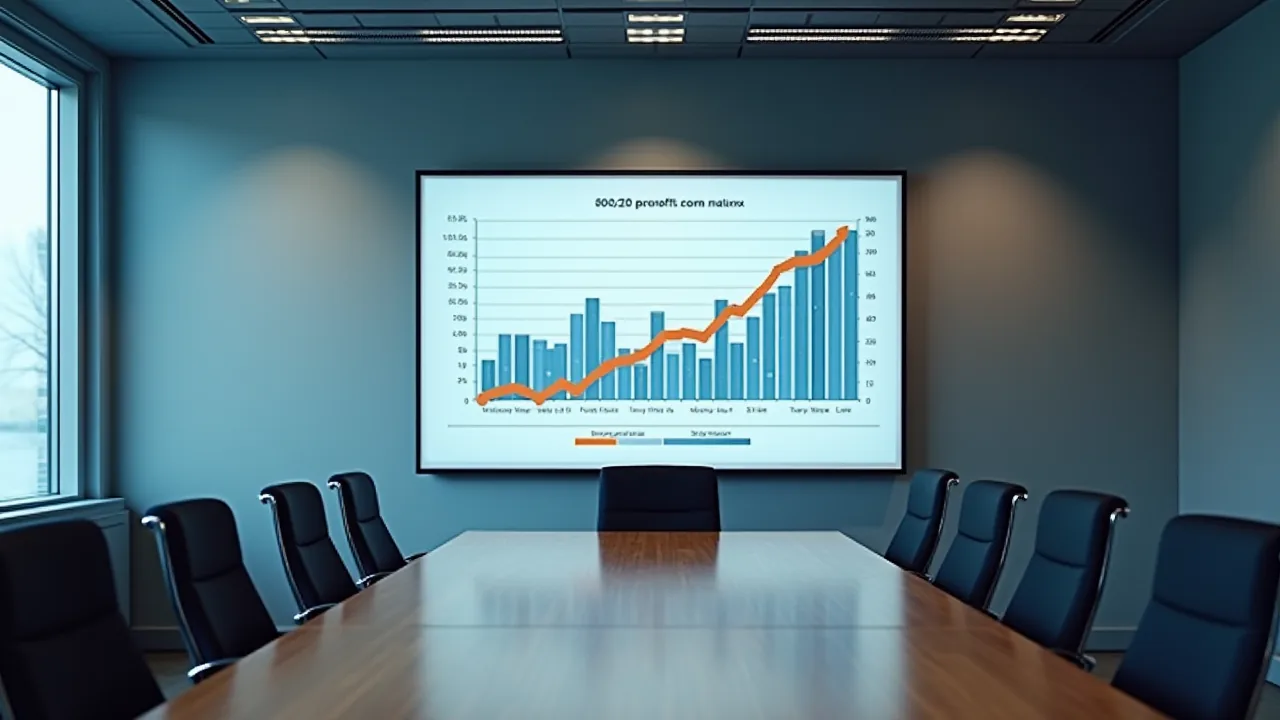
Map the Results on the 80/20 Matrix
Plot customer-product combinations, not customers alone, and give each quadrant a different strategy. The book's Refrigeration numbers:
- Q1, best customers x best products: 4 percent of combinations, 140 percent of profit. Strategy: protect and expand.
- Q2, smaller customers x best products: 18 percent of combinations, 35 percent of profit, but 43 percent of resources. Strategy: standardize and serve efficiently.
- Q3, best customers x weak products: 21 percent of combinations, destroying 18 percent of profit. Strategy: reprice, substitute, share the economics or exit.
- Q4, small customers x weak products: 55 percent of combinations, destroying 67 percent of profit. Strategy: immediate price increases. In the book's experience, 60 to 70 percent accept, about 10 percent modify orders, about 10 percent switch SKUs and 15 to 20 percent leave.
Go deeper in The 80/20 Matrix guide.
A 90-Day Roadmap
- Month 1: build templates and pull a year of orders, service hours, returns and freight by account.
- Month 2: score all 15 KPIs, map the matrix and list the surprises.
- Month 3: act on Q4 and Q3 accounts first, and redeploy the freed capacity to Q1.
Related reading on Stagnation Assassins: B-to-A Customer Development: 15 Strategies and Sales Transformation: 25 Quick Wins.
Frequently Asked Questions
What is customer profitability analysis?
It measures what each customer, or customer-product combination, earns after all costs to serve it, including engineering, setups, expediting, quality, freight and payment terms, rather than revenue or gross margin alone.
Which KPIs show an unprofitable customer?
High service intensity, heavy order complexity, frequent expediting, extended payment terms and a mix concentrated in your weakest products. Activity-based costing turns these into a true margin per account.
What should you do with unprofitable customers?
Reprice first, substitute a product you can deliver profitably, share the cost structure openly, and exit only if nothing works. In Stagnation Assassin, most value-destroying customers accepted a price increase.
Sources
- Todd Hagopian, Stagnation Assassin: The Anti-Consultant Manifesto, Chapter 4 (80/20 Matrix quadrants, activity-based costing example, Refrigeration division figures).
- The 15 KPI names are carried over from the previous version of this article; the unsourced opening anecdote and estimates were removed.
Put This to Work With Your Team
Stagnation Assassins exists to turn these frameworks into results inside real organizations. If your leadership team is putting in more work for less profit, pick one of two next steps. Book Todd Hagopian to speak at your leadership offsite or conference, or read the books and run the playbook yourself.